Debugging
Debugging is the most important skill in programming. It’s the skill that allows to find and fix problems in your code. It’s the skill that allows you to write better code.
Tools for debugging are built into Godot. You can use print statements and breakpoints to debug your code. Unfortunately tools aren’t super great but they do the job.
How to debug
Debugging is a skill that you learn by doing. The more you debug, the better you get at it. The most important thing is to be patient. Debugging can be frustrating, but it’s also very rewarding.
Debugging is an elimination process. You start by “shooting with a shotgun” and narrow down the problem until you find the cause. You can use multiple techniques to narrow down the problem.
Once you get better at debugging, you will start to see patterns in your code. You will start to see the same problems over and over again. You will start to see the same solutions over and over again. You will start to see the same mistakes over and over again. This is a good thing. It means that you are learning.
It’s also very rewarding to debug someone else’s code. It’s a great way to learn new things.
Print Statements
The most basic debugging technique is to use print statements. You can use
Godot print function to print a message to the output console. For example,
if you want to print the value of a variable, you can do it like this:
var player_score = 0
print(player_score)
You can also print multiple values:
var player_score = 0
var player_lives = 3
print(player_score, player_lives)
You can print most of Godot types including Vector2, Vector3, arrays,
dictionaries, and objects. Godot tries it’s best to output something useful.
The most effective way to use print statements is to print the value of a change in your code. For example, if you have a function that calculates the player’s score, you can print the value of the score before and after the function call:
var player_score = 0
print(player_score)
calculate_player_score()
print(player_score)
Another good place is to add print statements in if-elif-else statements:
if player_score > 100:
    print("Player score is greater than 100")
elif player_score > 50:
    print("Player score is greater than 50")
else:
    print("Player score is less than or equal to 50")
Breakpoints
Godot has a built-in debugger that allows you to set breakpoints. A breakpoint is a point in your code where the debugger will pause the execution of your program. You can then inspect the state of your program and step through your code line by line.
There are multiple ways to set breakpoints. The first way is to use the breakpoint
keyword:
var player_score = 0
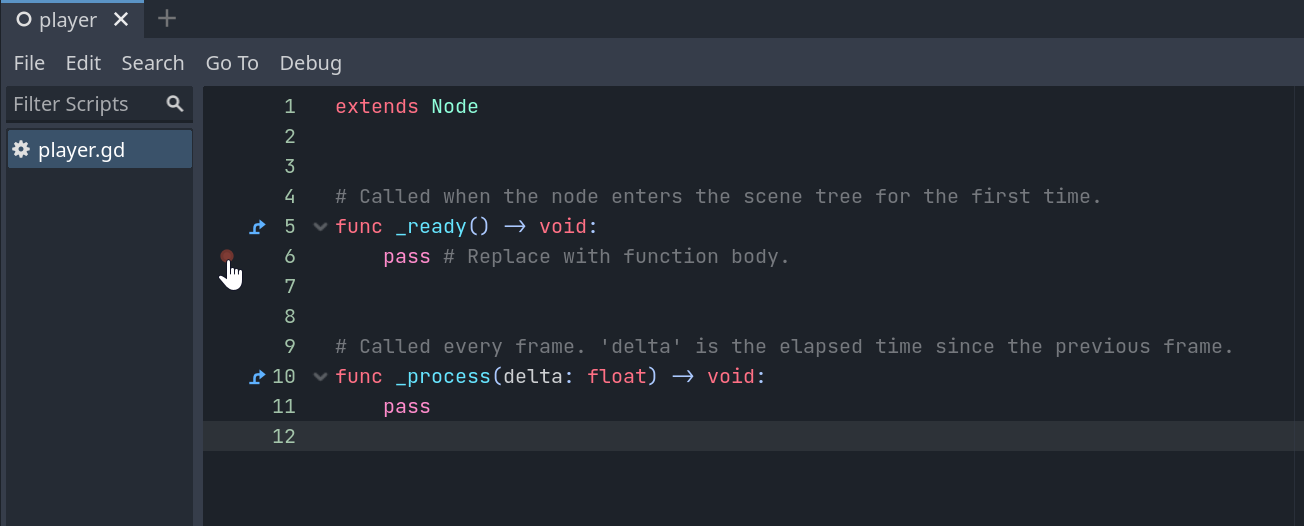
breakpoint()Second way is to click on the line number in the editor.
First you see a dim red dot when hovering over the line number:
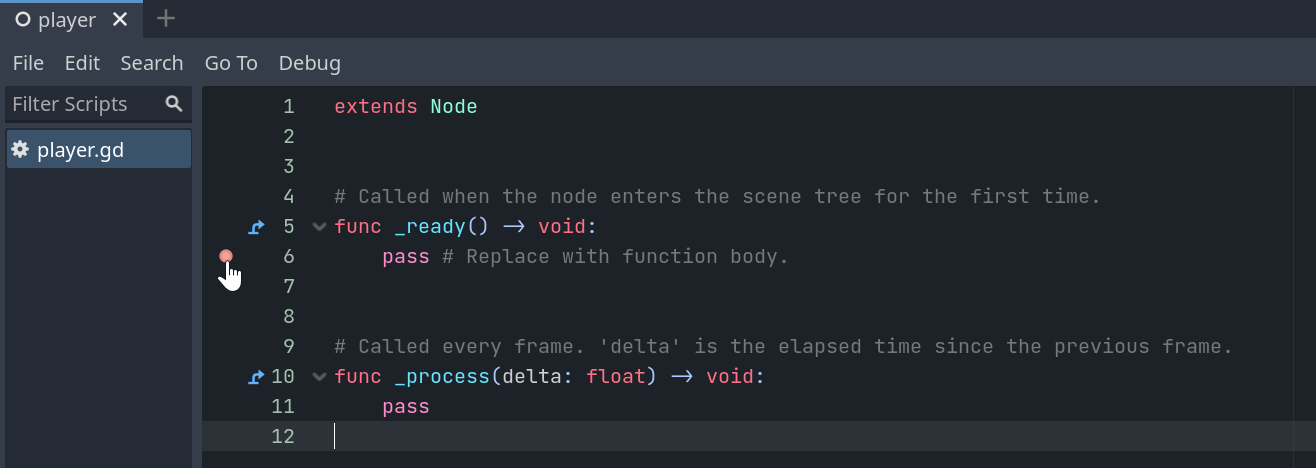
If you click on the line number, the dot becomes bright red:
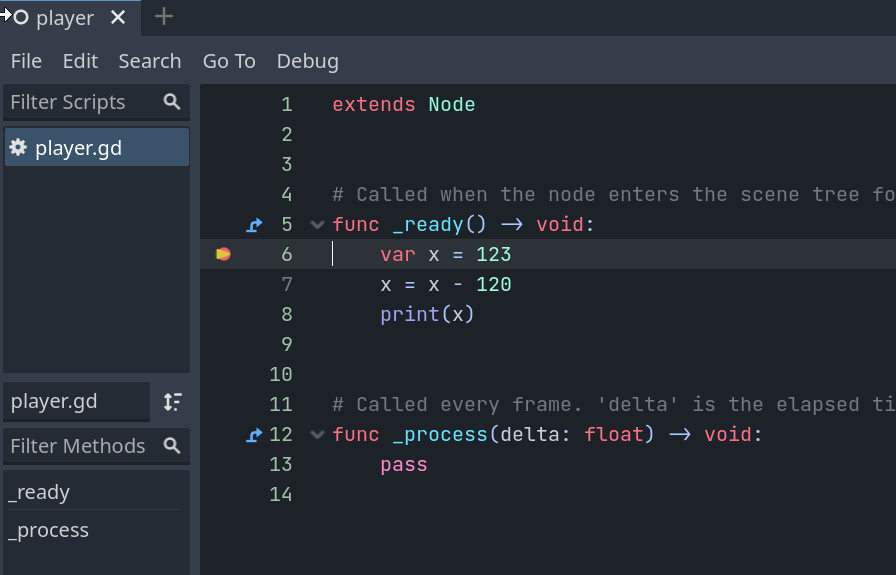
When you run your program, the debugger will pause the execution of your program when it reaches the breakpoint.
Current line /to be executed/ is highlighted with yellow arrow:
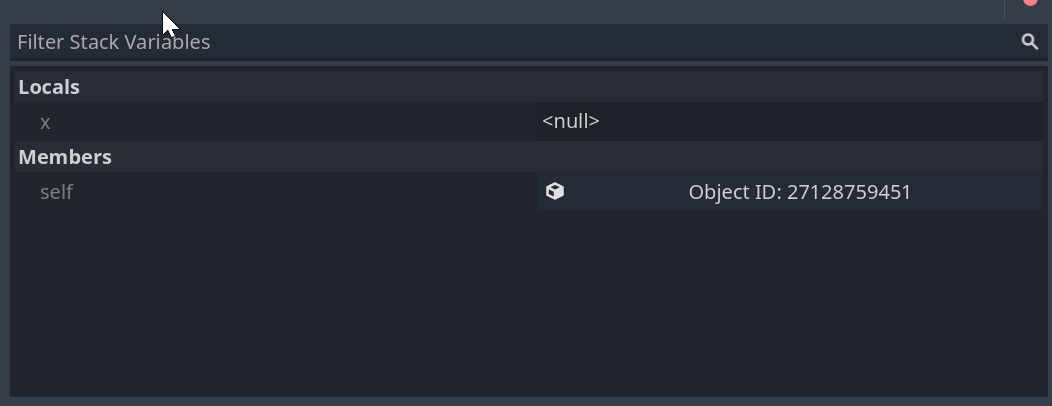
The most important things in Debugger panel are Variables and Call Stack.
Variables panel shows all the variables in the current scope. You can expand
the variables to see their values. You can also change the values of the
variables on the fly.
Call Stack panel shows the current call stack. You can click on the stack
frames to see the state of the program at that point.
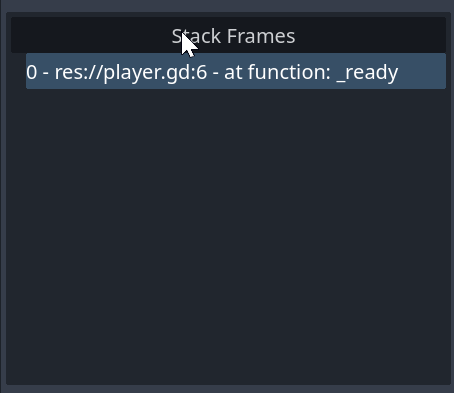
Call stack is the list of functions that are currently executing. For example, if you have a function that calls another function, the call stack will show both functions in the order they are called.